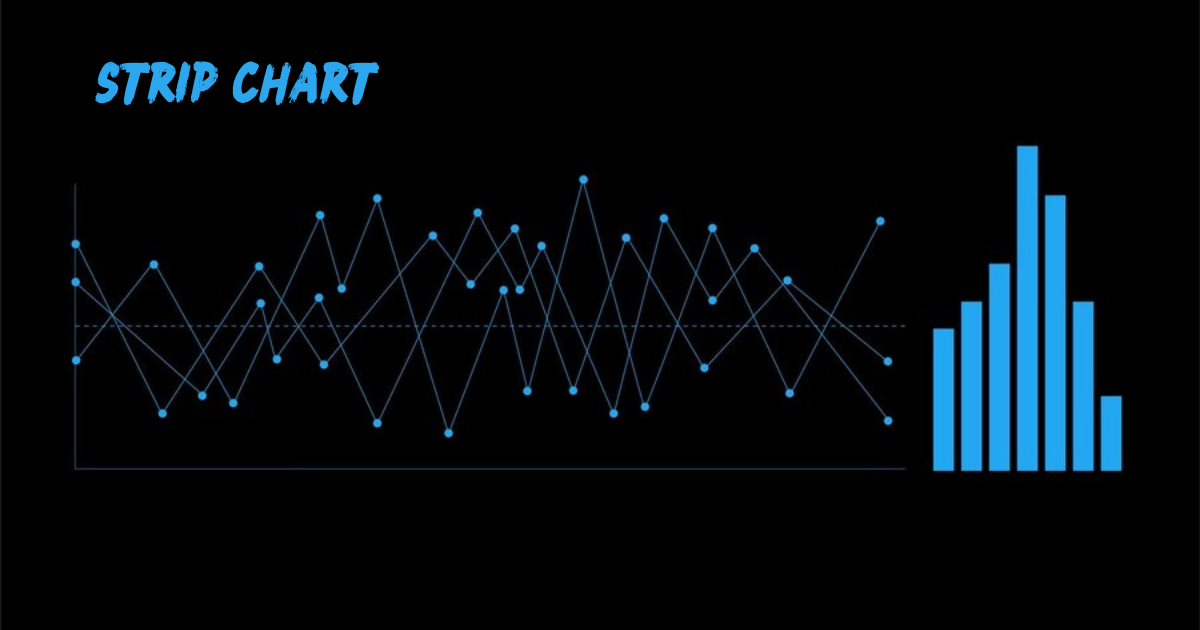
A strip chart is one of the most commonly used tools in various industries for visualizing data trends over time. Whether you’re involved in engineering, science, or data analysis, understanding how a strip chart works can provide significant advantages. In this article, we will explore what a chart is, its purpose, and how it can be utilized effectively.
What is a Strip Chart?
A strip chart is a graphical representation of data that displays changes over a specific period. These charts are designed to track the fluctuation of a variable on a continuous time scale, often seen in various fields like process monitoring, medical equipment, or even weather tracking. Typically, strip charts use paper or digital displays to plot the data, allowing the user to observe trends or identify irregularities in real-time.
Importance of a Strip Chart
The importance of a chart cannot be overstated. It allows users to monitor variables continuously, providing real-time data that can be crucial for decision-making processes. Whether it’s a production line or a health monitoring system, the ability to identify anomalies as they occur is invaluable.
Components of a Strip Chart
A strip chart generally consists of three main components:
Time Axis: The horizontal axis of the chart typically represents time. As data points are plotted, they move along this axis, showing how the variable has changed over the period.
Data Line: The plotted data forms a line, often fluctuating based on the values of the variable being monitored. This line is essential in tracking the trend of the data.
Scale: The vertical axis provides the scale for the data points, indicating the measurement or value of the variable being observed.
How Does a Strip Chart Work?
A chart works by continuously plotting real-time data on a moving strip of paper or digital screen. Each new data point is plotted in relation to time, and older data points slowly shift off the display as new ones take their place. This allows for immediate observation of data trends and is especially useful in environments that require constant monitoring.
Applications of Strip Charts
Strip charts are widely used in various fields. Some of the most common applications include:
Medical Monitoring: Devices like electrocardiograms (ECG) use charts to monitor heart activity. These charts allow doctors to observe heartbeats in real time and identify any irregularities.
Industrial Monitoring: In manufacturing, strip charts are used to monitor machine performance. Any unexpected spikes or dips in the data can help technicians prevent equipment failure.
Environmental Monitoring: Strip charts are used to track changes in environmental variables such as temperature, humidity, and wind speed over time.
Advantages of Using Strip Charts
There are several advantages to using charts for data visualization and analysis:
Real-Time Monitoring: charts offer real-time updates, which can be crucial in time-sensitive environments.
Simple to Understand: The visual nature of a chart makes it easy for anyone to interpret the data, even those without extensive technical knowledge.
Long-Term Data Tracking: Strip charts allow for the long-term tracking of variables, making it easier to spot trends or recurring patterns over time.
Versatile Application: Strip charts are used in various industries, including medical, environmental, and manufacturing, making them a versatile tool.
Limitations of Strip Charts
Despite their advantages, strip charts have limitations that users should be aware of:
Limited Data Storage: As new data is added, older data is typically pushed off the chart, limiting the amount of historical data that can be viewed at one time.
Potential for Data Overlap: When dealing with rapidly fluctuating data, the lines on a strip chart may overlap, making it difficult to interpret.
Requires Constant Attention: Since strip charts often display real-time data, they require constant monitoring, which can be demanding in certain environments.
Types of Strip Charts
Several types of strip charts are available, each suited to different applications:
Single Channel Strip Chart: This type monitors one variable at a time. It’s ideal for simple applications where only one parameter needs to be tracked.
Multi-Channel Strip Chart: A multi-channel strip chart can monitor multiple variables simultaneously. This is especially useful in complex systems that require the observation of several factors at once.
Strip Chart Recorders
A strip chart recorder is a device that records data onto a continuous strip of paper or digitally onto a display screen. These recorders are used in various industries for tasks such as monitoring temperatures in industrial ovens or tracking heart rates in hospitals.
Digital Strip Charts vs. Paper Strip Charts
Traditionally, strip charts were recorded on paper. However, with advancements in technology, digital strip charts have become more common. Digital strip charts offer several advantages, such as:
Easier Data Storage: Digital records can store larger amounts of data compared to paper.
More Accurate Measurements: Digital systems can take more precise readings.
Better Data Analysis: Data recorded digitally can be more easily analyzed using software tools.
When to Use a Strip Chart
A strip chart is ideal for situations where you need to monitor data continuously over time. For instance, if you’re managing an industrial process that operates 24/7, a chart can help you identify any unusual activity that may require immediate attention.
How to Read a Strip Chart
Reading a strip involves analyzing the data line to identify trends, spikes, or dips. Consistent patterns usually indicate normal operation, while sudden changes can be a sign of malfunction or an abnormal event. The ability to read and interpret a strip accurately is crucial for making informed decisions based on real-time data.
Alternatives to Strip Charts
While strip charts are incredibly useful, there are alternatives that some industries prefer depending on their needs:
Bar Graphs: These are ideal for comparing data at specific points in time rather than continuous monitoring.
Line Graphs: Similar to charts but often used for historical data analysis rather than real-time monitoring.
Maintenance of Strip Chart Recorders
Maintaining a strip chart recorder is essential to ensure accuracy. For paper-based recorders, regular replacement of the paper roll and ink is necessary. For digital recorders, software updates and system checks are crucial to keep the device functioning correctly.
Conclusion
a strip chart is an indispensable tool for real-time data monitoring across multiple industries. Whether you’re tracking heart rates in a medical setting or monitoring environmental conditions, the strip chart provides a simple, effective way to visualize and analyze data over time. Despite a few limitations, its ease of use, real-time capabilities, and versatility make it a go-to tool for many professionals.
FAQs
What is the main purpose of a strip chart?
The main purpose of a chart is to provide real-time visualization of data trends over time, allowing for continuous monitoring of variables.
How does a strip chart differ from a line graph?
While both display data trends, a strip chart focuses on real-time data, while a line graph is typically used for historical data analysis.
Can I use a strip chart for monitoring multiple variables?
Yes, multi-channel charts can monitor several variables simultaneously.
What are the key advantages of digital strip charts over paper ones?
Digital charts offer better data storage, more accurate measurements, and easier data analysis compared to paper-based systems.
Are strip charts still used in modern industries?
Yes, strip charts remain widely used in various industries, particularly in environments that require continuous monitoring of real-time data.


